Exhibit 1 shows the 2024 performance for a sample of Morningstar analyst-rated exchange-traded funds that represent major sections of the stock and bond markets. Weak December returns left but a small scratch on a shining year. The blended portfolio climbed 10.9% in 2024, led by US stocks.
Bond Market Review
US bonds slid in December in a fitting conclusion to their subpar year. Vanguard Total Bond Market ETF BND shed 1.7% last month to clinch a paltry 1.4% gain on the year. That fell shy of the rising costs of goods and services, as the latest reading of the Consumer Price Index pinned year-over-year inflation at 2.75% through November. In other words, broad bond indexes did not keep up with inflation in 2024.
Oscillating economic data steered the bond market through an up-and-down year. Over the first four months of 2024, BND slid 3.1% as several warmer-than-expected inflation readings delayed the expected timeline for interest-rate cuts. The ETF rallied 6.4% over the next four months when inflation softened and economic growth held steady. Its 2024 high-water mark came on Sept. 16, two days before the first rate cut of the cycle, as markets toasted to victory over inflation. The following months brought more hot inflation data that rendered that celebration premature, though. The Federal Reserve announced fewer expected rate cuts in 2025, causing BND to pull back 1.7% over the final third of 2024.
The whirlwind of economic news was kinder to short-term bond funds than long. IShares Short Treasury Bond ETF SHV gained 5.1% in 2024, for instance. It returned nearly 12% over the past three years, proving that it can preserve wealth in a challenging environment. Portfolios stuffed with longer-term bonds continued to take it on the chin, though. IShares 20+ Year Treasury Bond ETF TLT lost 8.1% in 2024. A popular chip for betting on interest rates, the fund lost nearly 35% of its value over the past three years (a span in which it has absorbed roughly $45 billion).
Bond ETFs built around credit risk outperformed those that respond to rates. IShares Broad USD Investment Grade Corporate Bond ETF’s USIG 2.6% return didn’t jump off the page but cleared the broad fixed-income market. Credit spreads gradually tightened throughout the calendar year, rewarding many of the fixed-income funds willing to lend to lower-quality borrowers. SPDR Bloomberg High Yield Bond ETF JNK rode its riskier (and shorter-maturity) holdings to a 7.7% return last year. The outlook for high-yield bond funds like JNK is not promising, though. My colleague Alec Lucas notes that the spread between high-yield and Treasury bonds ranks within the tightest decile relative to their history dating back to the mid-1990s. Those high valuations leave little room to run but plenty of room to fall.
Stock Market Review
US stocks rattled off another excellent year. IShares Core S&P Total US Stock Market ITOT soared 23.8% and has now climbed 56.1% over the past two years—a superb rebound from the drawdown that plagued 2022. Balancing economic growth with tempered inflation, insatiable demand for artificial intelligence (and the hardware that powers it), and the election of Donald Trump all fueled this year’s market rally. US companies generated strong earnings with help from those big-picture tailwinds. ITOT’s price/earnings ratio ticked upward to 21.3 from 19.8, a fairly modest increase considering the return.
My colleague Sarah Hansen examines the 2024 market rally through sector, style, and regional lenses here.
Foreign stocks trailed well behind their US counterparts in 2024. Vanguard Total International Stock ETF VXUS scratched out a 5.1% return on the year, hamstrung by a 7.4% drawdown in the fourth quarter. Much of that trouble traced back to Europe. iShares Core MSCI Europe ETF IEUR gained just 1.4% on the year after it shed 10.3% in the final quarter. The strengthening US dollar made it hard to keep pace, and much of the Trump enthusiasm in the US had the inverse effect overseas. Valuations indicate that brighter days might be ahead for foreign stocks. That has been the case for most of the past 15 years, though, a span in which Vanguard Total Stock Market ETF VTI trounced VXUS by about 8.7 percentage points per year.
10 Notes on ETFs’ Banner Year
1) ETFs broke records in 2024
Investors dumped roughly $1.1 trillion into US ETFs in 2024, shattering the record $901 billion set in 2021. The record year hardly came out of nowhere. Investors have flocked to ETFs for most of the past decade, even in down market years.
And 2024 was anything but a down year. Cruising equity markets helped coax money from savings accounts or money market funds into long-term investments. Broad US stock indexes that underpin the market’s largest ETFs were some of the year’s best performers.
More outflows from mutual funds boosted net flows into ETFs. Investors yanked $341 billion from US mutual funds from January through November 2024. Mutual fund and ETF flows are hardly a zero-sum game, but some of the money that leaves the former flows into the latter.
Finally, the mere size of the ETF menu could have induced more demand. More than 4,000 ETFs traded in the US at the end of 2024, many of which launched last year and instantly met latent demand. Spot bitcoin ETFs are the best example. Hundreds of active ETF launches expanded the choices available. And more products surfaced to meet niche desires like leveraged single-stock exposure or specific downside protection. The ETF market now offers something for everyone, and everyone wanted something in 2024.
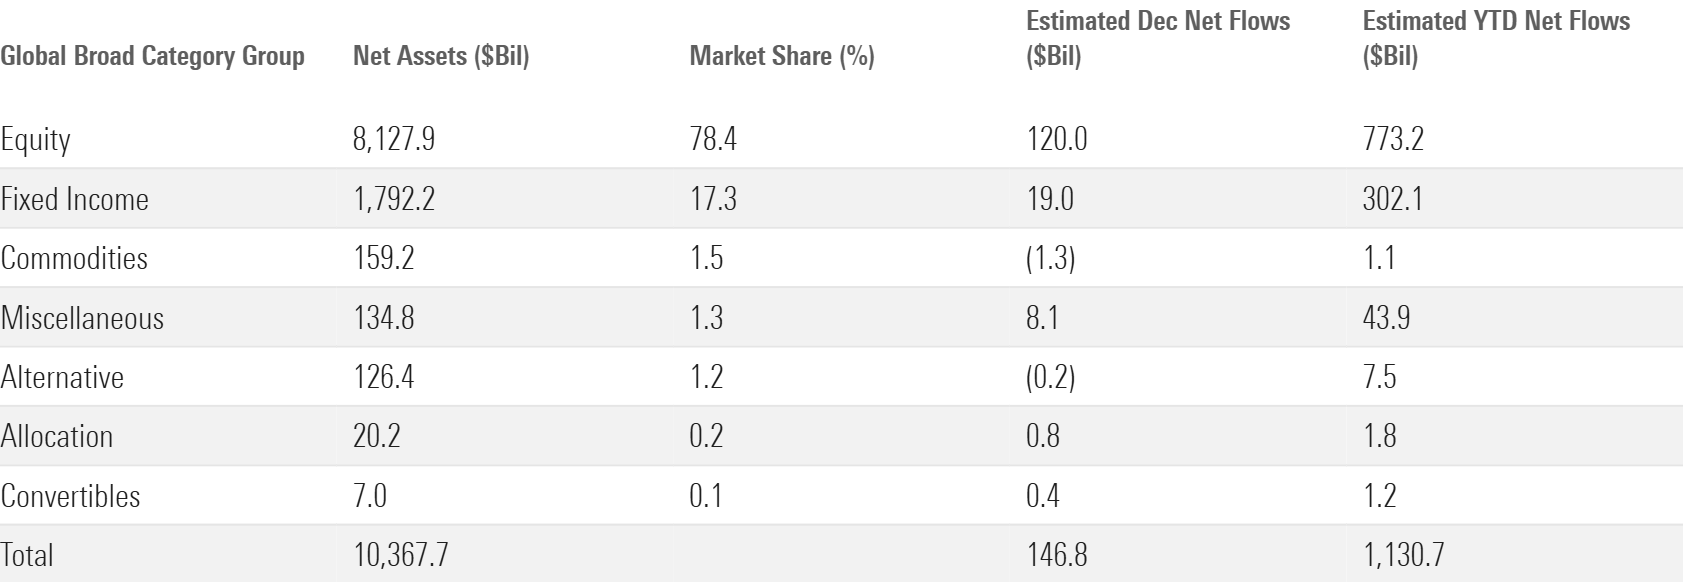
2) Workhorse index funds helped US equity ETFs rake in $591 billion
Even in a year littered with records, US equity funds stood out in 2024. Their $591 billion haul cleared the previous annual record by more than $200 billion.
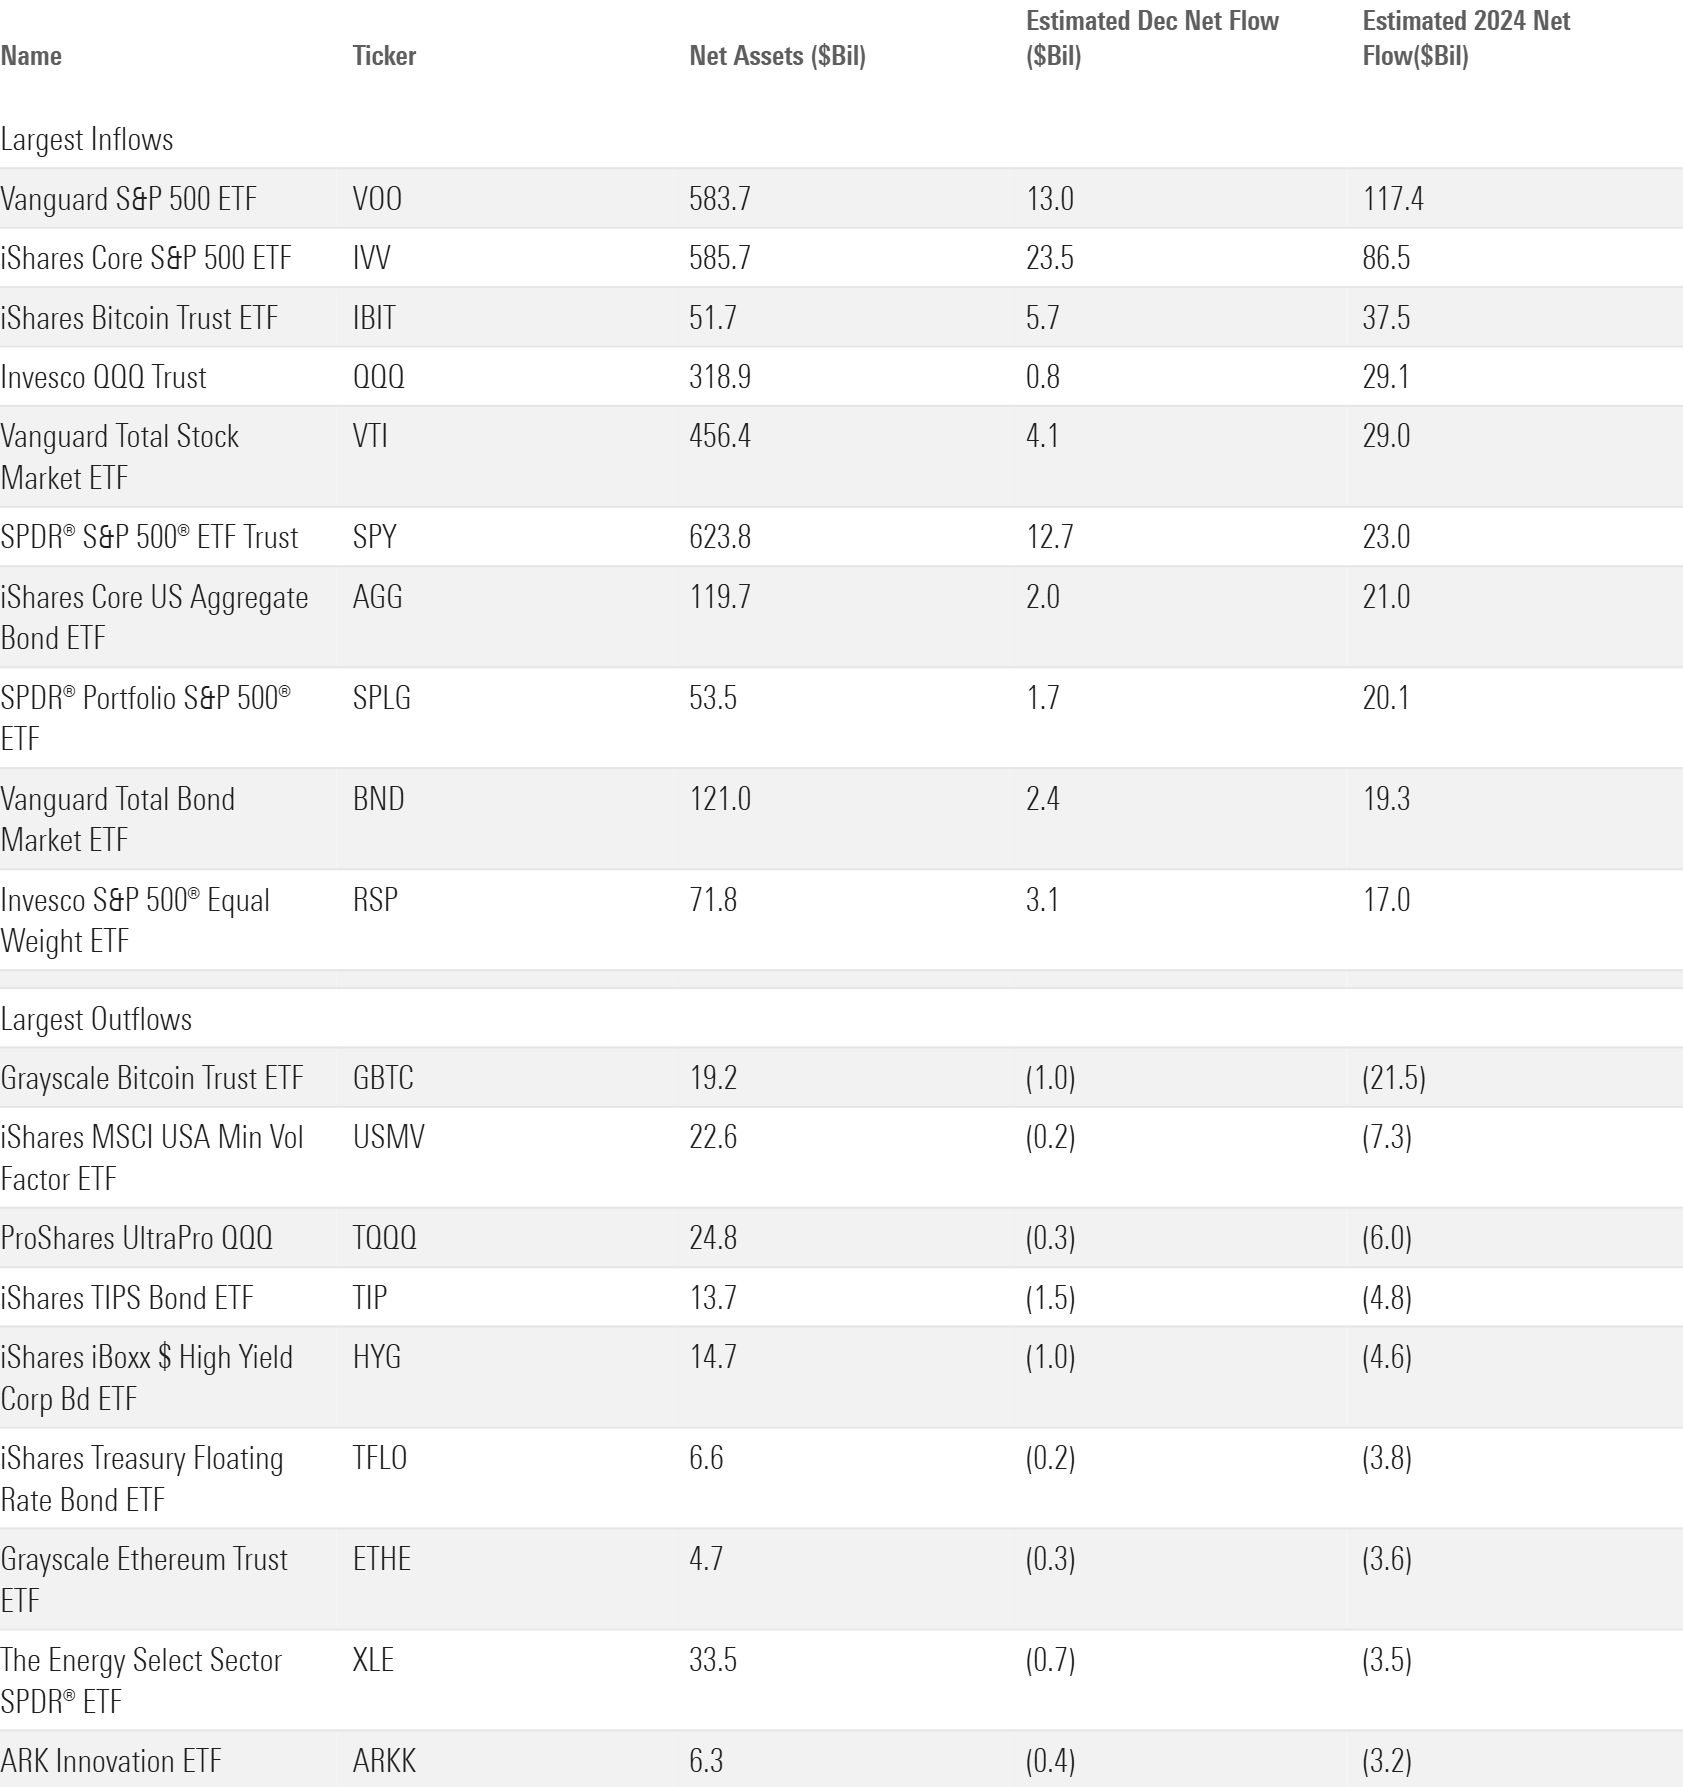
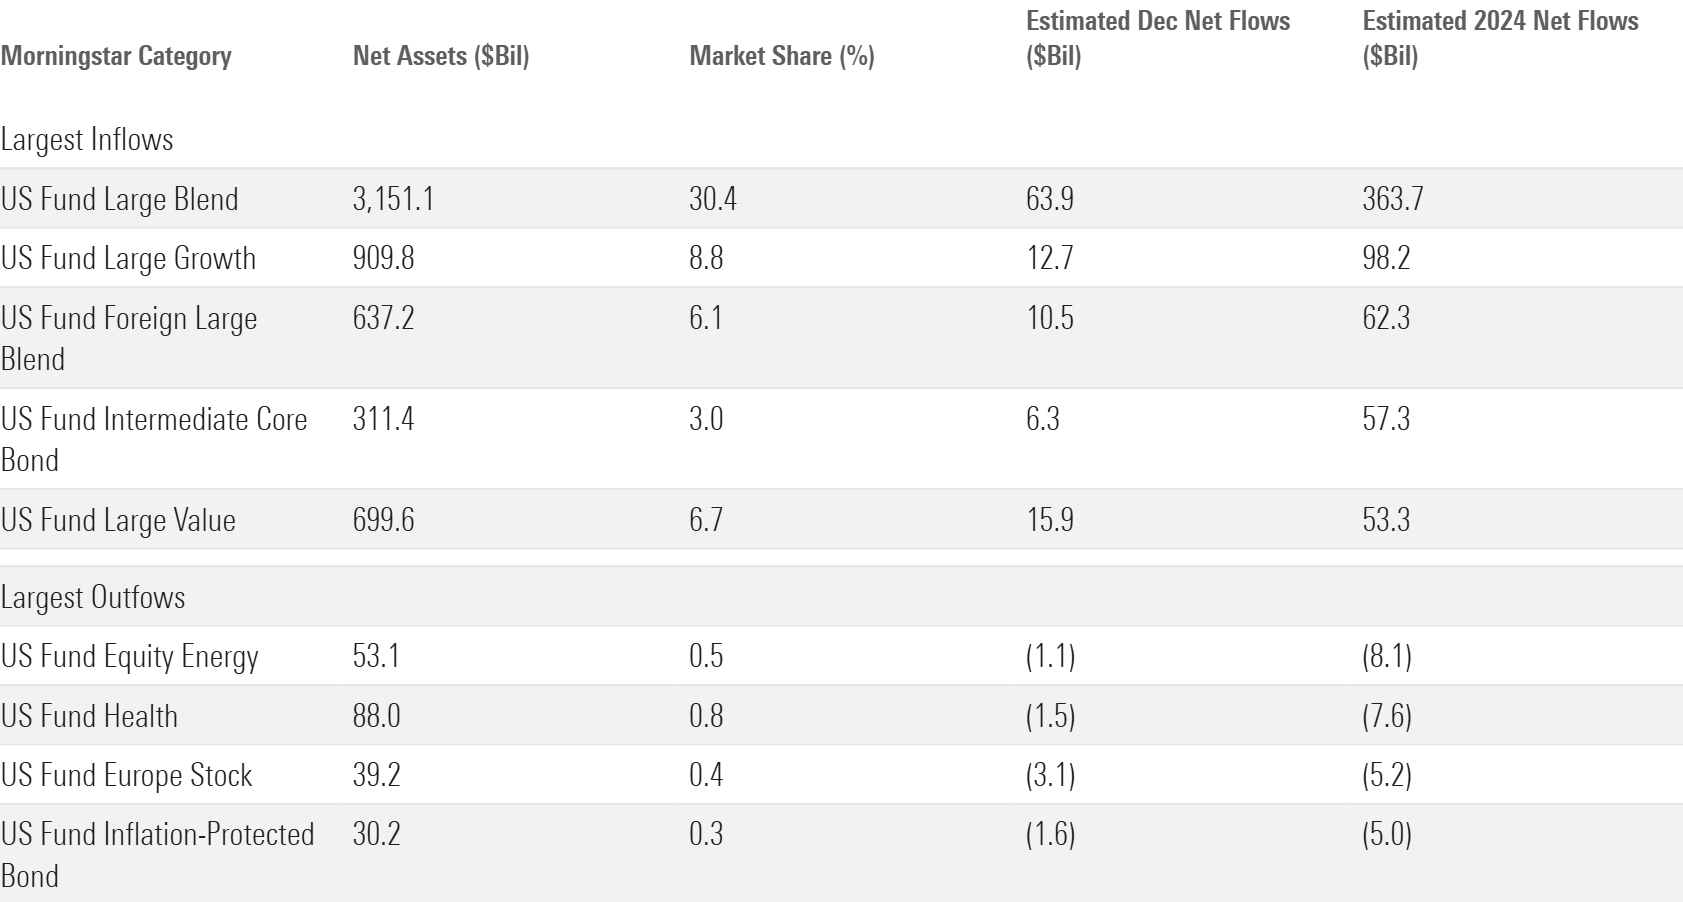
Broad, market-cap-weighted index trackers deserve the most credit. Vanguard S&P 500 ETF VOO inhaled $117 billion itself. That destroyed the previous individual ETF record of $51 billion and exceeded the 2024 flows into every ETF provider except iShares and, naturally, Vanguard. IShares Core S&P 500 ETF IVV also broke the previous record with an $87 billion year of its own but won’t receive the same notoriety—Sammy Sosa to VOO’s Mark McGwire in the 1998 MLB season. That duo helped the large-blend Morningstar Category collect $363 billion in 2024, nearly one third of all ETF flows.
Acknowledging the immense flows into these plain-vanilla index trackers offers a reminder. Despite the constant waves of innovation, the ETF market is shaped by some of its earliest, most basic products. Don’t expect that to change anytime soon.
3) Other US equity categories pulled their weight
US stock funds that target corners of the broad market also fared well in 2024. The large-growth category pulled in $98 billion, more than doubling its 2021 annual record. Nasdaq 100 Index trackers Invesco QQQ Trust QQQ and Invesco Nasdaq 100 ETF QQQM set the pace. The tech twins jointly garnered $44 billion of inflows as their topline holdings generated superb returns.
The mid- and small-blend categories notched 2024 inflows of $30 billion and $27 billion, respectively. Both sums marked annual records. As in the large-blend space, investors showed comfort sticking with cap-weighted index funds. IShares Core S&P Mid-Cap ETF IJH led its category with nearly $9 billion of inflows, and Vanguard Small-Cap ETF VB followed suit with roughly $6 billion.
Small-value funds’ record $15 billion haul drew on a more eclectic blend of products. Avantis US Small Cap Value ETF AVUV, a systematic active strategy, collected roughly $5 billion on the year. First Trust Smid Cap Rising Dividend Achievers ETF SDVY collected nearly the same amount in a breakout year.
4) International-stock ETF flows paled in comparison to their US peers
The international equity category group tallied about $99 billion of inflows in 2024. That’s a fine sum but a far cry from the levels this cohort reached in 2021 ($169 billion) and even 2017 ($149 billion). You can probably chalk it up to returns. VXUS trailed VTI by nearly 19 percentage points in 2024, the 12th year in the past 15 in which foreign stocks trailed their domestic counterparts.
International stock funds that cover the most ground were the most popular in 2024. The foreign large-blend and global large-stock blend categories, which transcend region and style, jointly claimed about three fourths of all international stock flows. Categories that target the Asia-Pacific, Latin America, or Europe regions finished with outflows. India-, China-, and Japan-specific funds each scratched out inflows for the year but trended in the wrong direction when 2024 concluded.
5) Technology and financials flows propped up the sector-equity space
Sector-specific equity funds collected $30 billion in 2024, their first positive year since reeling in $102 billion in 2021. Investors’ insatiable demand for artificial intelligence made technology the standout sector category with $25 billion of inflows. Vanguard Information Technology ETF VGT led with $8 billion of new money, but smaller semiconductor funds excelled, too. VanEck Semiconductor ETF SMH hauled in nearly $7 billion on the year, for instance, growing its base to $23 billion from $11 billion over the past 12 months.
ETFs that track the financial-services sector chimed in with $10 billion. About $8 billion of that came in November alone, as markets cheered Trump’s nomination as a harbinger of deregulation standing to benefit banks and other financial institutions.
It was an otherwise weak year for sector ETFs. Half of the 16 categories finished the year in the red, including those that target energy and healthcare stocks with $8 billion of outflows apiece.
6) Balance was key as taxable-bond funds hauled in $283 billion
The taxable-bond category group blew past its previous annual record of $196 billion. Well-rounded inflows powered the tremendous 2024 campaign. Twenty-two of 26 categories posted inflows on the year, 11 of which absorbed north of $10 billion. From Treasuries to high-yield corporates, ultrashort to long-term, and preferred stock to syndicated bank loans, investors bought up just about everything fixed income in 2024.
Some breakout individual ETFs sparked the strong flows into their categories. The ultrashort bond category collected $48 billion with help from Janus Henderson AAA CLO ETF JAAA and its $11 billion haul. Intermediate core-plus bond funds raked in $32 billion, about one third of which went to Fidelity Total Bond ETF FBND. Multisector bond ETFs could not have grown to $18 billion from about $3 billion in 2024 without iShares Flexible Income Active ETF BINC and its lucrative year. Those are just a few examples of actively managed products that helped take bond ETFs to another level.
7) Active ETFs took another leap
Active ETFs pulled in about $295 billion last year, good for an organic growth rate of 57% and more than double the annual record they set in 2023. Framed differently: actively managed strategies represented 6% of the ETF market entering 2024 yet claimed 26% of all net flows.
Active ETFs resonated best in the fixed-income universe. Active taxable-bond ETFs collected $104 billion in 2024, or 37% of net flows into the cohort including active and passive ETFs. That ratio landed at just 11% in the US equity group. It was about one third for international equity funds, which equated to $34 billion of active inflows. Active ETFs helped fuel the rise of bond categories like intermediate core-plus, multisector, ultrashort, and bank loan—all of which set or closely contested annual records in 2024.
Active ETFs may well garner even more inflows in the year ahead. Fund providers have converted existing mutual funds or launched similar ETFs at a breakneck pace. Entirely new strategies emerge constantly. Should the SEC approve the 43 (and counting) applications to tack ETF share classes onto mutual funds, another gate into the active ETF market would swing wide open.

8) Spot bitcoin ETFs delivered on the hype
The ETF story of the year came in its first two weeks when the “new nine” spot bitcoin ETFs hit the market. Investors had long clamored for ETFs that track the spot price of bitcoin and proved it when they arrived. The new nine raked in $27 billion in the first quarter of 2024 alone, cannibalizing Grayscale Bitcoin Trust ETF GBTC, the trust-turned-ETF that lost its stranglehold on the market when the spot ETFs launched. Bitcoin ETF net flows totaled $12 billion in the first quarter after accounting for GBTC.
Momentum slowed during the middle of the year. Bitcoin ETFs absorbed just $8 billion from April through September. With little meat left on GBTC, it seemed the frenzy had finished. But flows into bitcoin products finished strong. Investors dumped in about $21 billion in the fourth quarter as bitcoin raged to close out the year. When the book closed on 2024, bitcoin had soared 121% and the ETFs that track it hauled in about $35 billion.
9) Risk-conscious ETFs flexed their staying power
Covered-call and buffer ETFs broke out in the early 2020s, quickly transforming from relative unknowns to some of the most popular ETFs on the market. Both offer some degree of downside protection that made them solid bear market bets. But these ETFs didn’t go anywhere even as the market rallied in 2024.
The derivative-income category, home to covered-call ETFs, raked in nearly $35 billion last year. JPMorgan Equity Premium Income ETF JEPI and JPMorgan Nasdaq Equity Premium Income ETF JEPQ historically dominated this space, but the flows broadened out in 2024. That duo combined for less than half the category’s net flows for the first time since 2021 (before JEPQ hit the market). More than 90% of derivative-income funds welcomed inflows in 2024.
Buffer ETFs broke out in 2022 because they help guard from the market’s downside. They remained in vogue last year, collecting $14 billion in 2024 on the heels of two straight $10 billion years.
The rise of these funds coincided with the demise of low-volatility stock portfolios. ETFs in the risk-oriented strategic beta group shed $13 billion in 2024. They have bled between $10 billion and $15 billion in four of the past five calendar years, in which time their asset base shrunk in half. IShares MSCI USA Minimum Volatility Factor ETF USMV was hit hardest: Its $7 billion outflow was second-worst among all ETFs, behind GBTC.
10) Vanguard kept the crown
The competition for the 2024 ETF flows title was a two-horse race between Vanguard and iShares, the two largest providers. Vanguard emerged victorious with $308 billion of annual inflows, marking the fifth straight calendar year it finished on top.
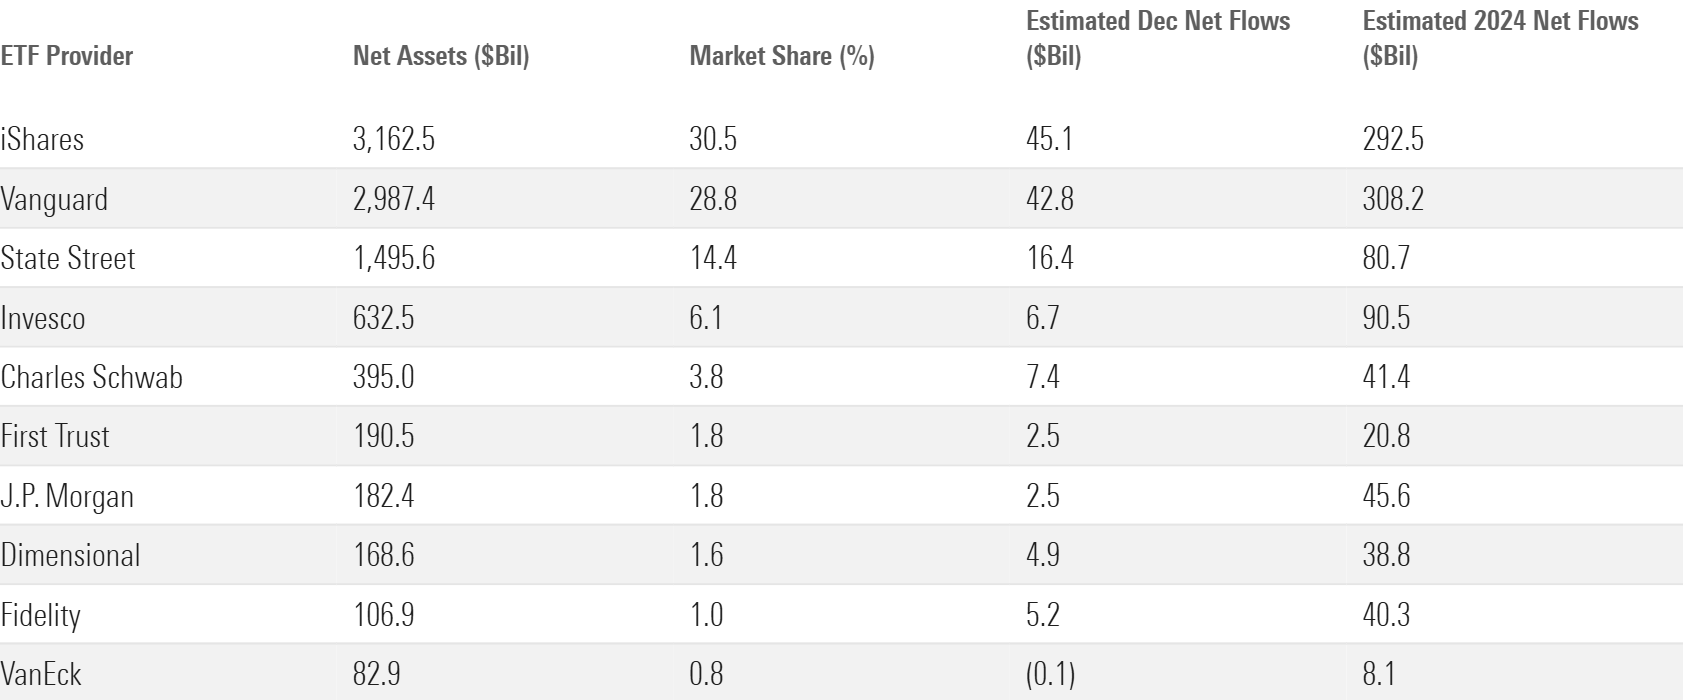
Vanguard’s formula was simple: Sell diversified, low-cost index funds to a disciplined base of investors. VOO and its jaw-dropping flows are the prime example. Fellow plain-Jane funds like VTI, Vanguard Growth ETF VUG, and Vanguard Value ETF VTV all had lucrative years as well. US equity remains Vanguard’s bread and butter—those funds claimed two thirds of the firm’s 2024 net flows—but its bond lineup kicked in $59 billion. BND starred with roughly $19 billion of inflows in 2024.
IShares gave Vanguard a run for its money. Still the largest ETF provider in the US, it pulled in $293 billion of its own. IShares sports a more sprawling menu of offerings than Vanguard. That served it well in 2024 as its fixed-income, international equity, and alternative (mainly bitcoin) ETFs all welcomed healthy inflows. That diversified lineup may benefit iShares in more challenging market years, though Vanguard had the upper hand in 2022.
The two largest ETF providers, nearly 60% of the market combined, are in a league of their own. IShares’ US ETF lineup is about $175 billion larger than Vanguard’s—about the same amount that Vanguard made up on it from 2022 to 2024.

